Possibly the worst part about running an online service is when it crashes, or worse, being unaware that it crashed. This post pertains to how to monitor your service effectively at a low cost. The key things to know about your service includes three critical questions, and our suggested effective solutions to them.
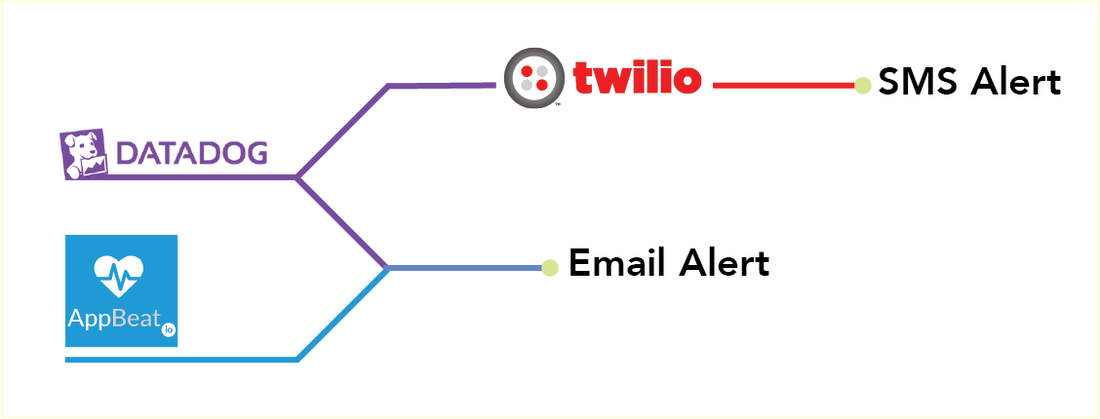
AppBeat is a service that monitors the ports and their latency from external servers from different locations on the globe and reports the analysis results on your dashboard; every day and every hour. Some benefits of using this service include the comforting knowledge that your apps are constantly being monitored and watched over, the high availability of services which often equates to high customer satisfaction, the detection of slow response times, and the critical prevention of unexpected outages. What’s more, it can integrate with other services like Slack and Pagerduty to report alerts on these.
Datadog on the other hand is a service that monitors various parameters on the server including CPU load, memory consumption, network I/O, disk IO, temperature, and many more. Benefits of this service include aspects in Integrations, Dashboards, Correlations, Collaborations, Metric Alerts, and Developer API. While there is a lot of information regarding all of these aspects, one of the main distinguished features include the fact that it sends data to the dashboard where the user can see it and configure/trigger alerts if anything goes wrong.
Regarding the low cost part mentioned above, another advantage of both Datadog and Appbeat is that they have free plans, so the setup cost for monitoring solutions is zero. This is a great alternative to paid services like Pingdom and Newrelic (which are fine services in their own right), making it a good option for startups with tighter budgets.
Before we start the set-up process for the monitoring system we have to identify a few things first, such as the email and mobile number you want to send alerts to and a credit card to sign up for Twilio (you only pay per-user at a nominal cost). We will first start off for cases with a use-purpose like running a blog, where just using Appbeat is good enough. We’ll cover Datadog and Twilio in a future posts.
How to setup Appbeat
- Create an account with Appbeat.io
- Verify your email address
- Following this, go to “Services & Checks” on the left panel in your dashboard.
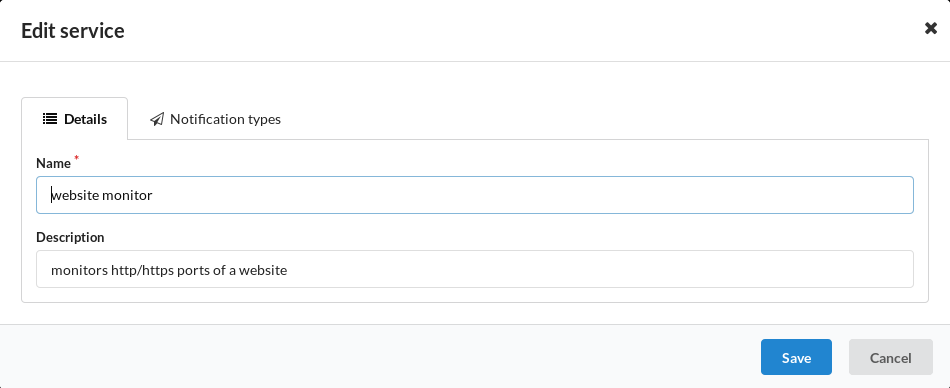
- There you’ll see an option to add a new service. Click on it and your screen should look like the one below,
- Fill out the following form and click “Save”.
Once you’ve added the new service, the next step involves adding checks that are to be grouped under that service.
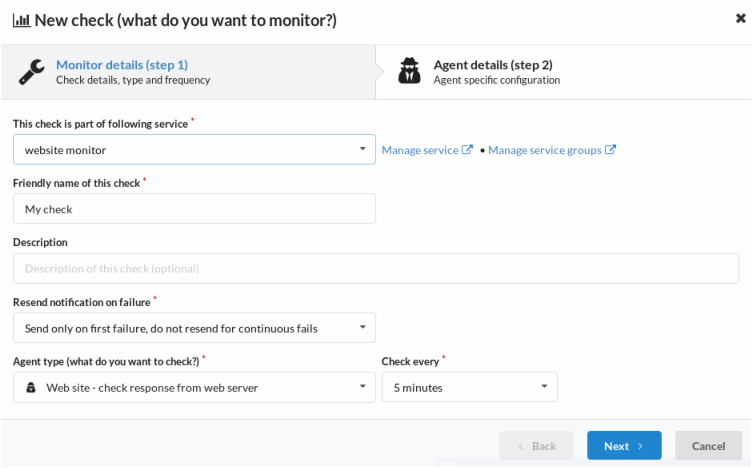
- Click on the tab labeled “Checks”
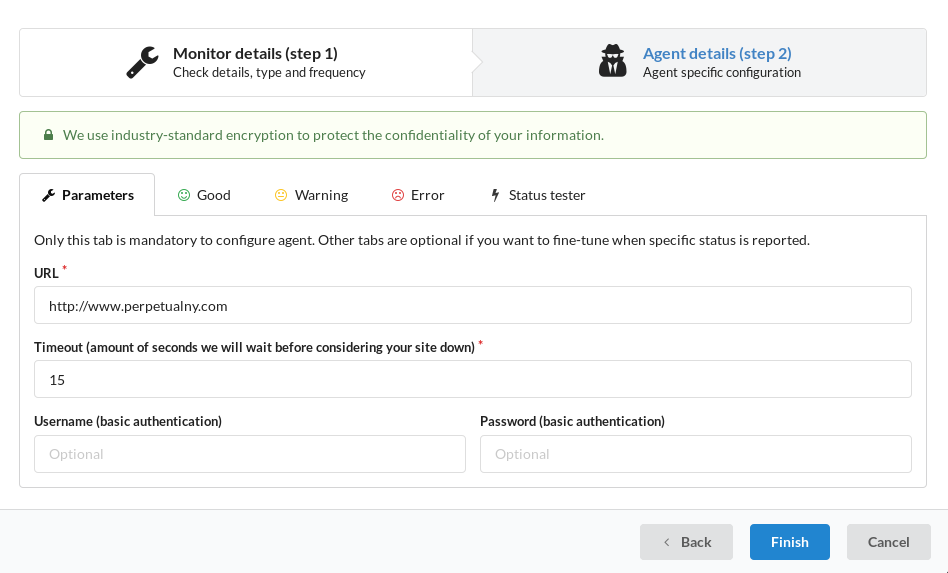
- Click on “Add a new Check”. You’ll get a screen that asks for information about the check
- Fill it out and click “Next”.
- There it will ask you to input the URL that’s to be monitored and the time interval at which it is monitored. (suggested interval time: 5 mins)
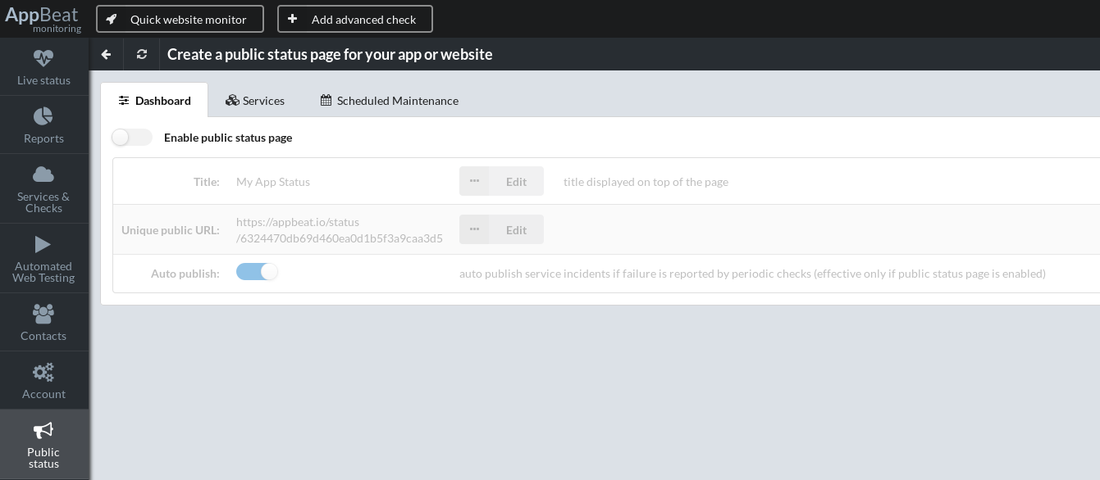
If you want the public to see if the services are operational or not, you can create a Public Status page. This can be easily made in the “Public Status” section in the side panel. Simply:
- Enable the public status page
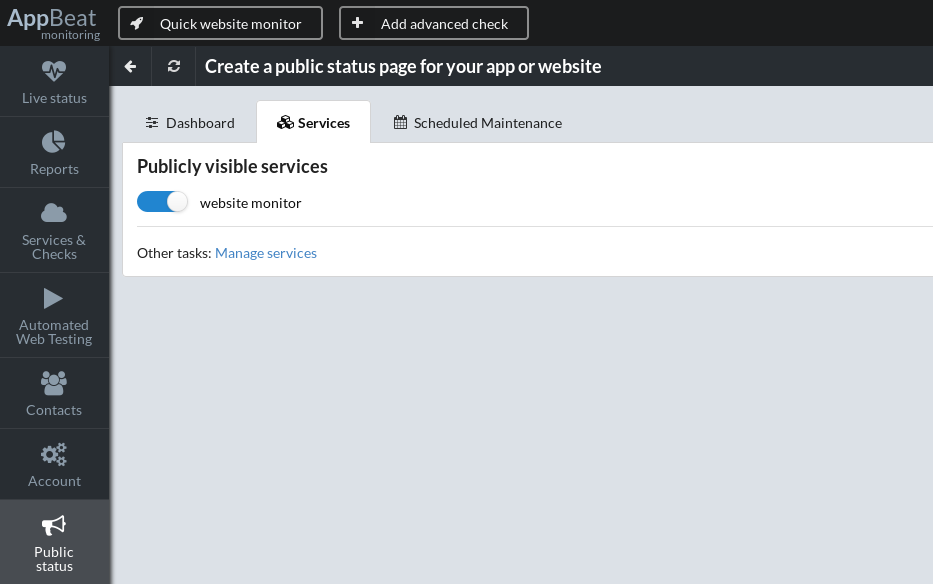
- Click on the “Services” tab on the same page to select the services you want to display to the public.
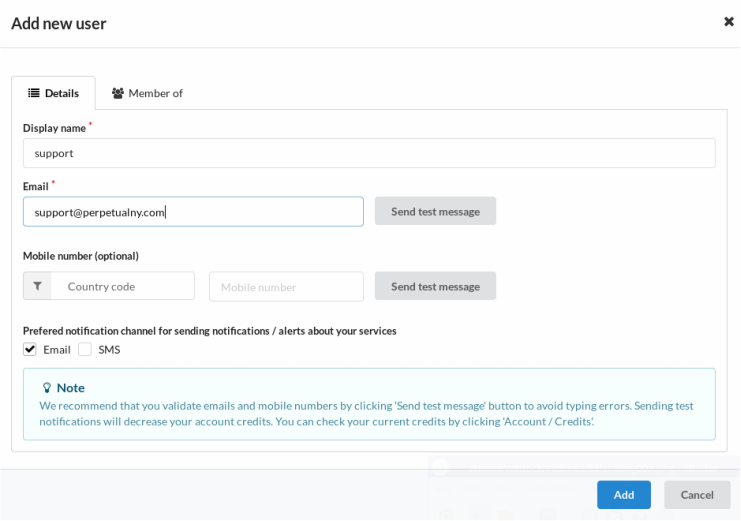
If you want to add new users to the site, where they can also look at the data received, they can be added through the “Contacts” section in the side panel.
- Click on “add new user”
- Input the email address and mobile number
- Click whether Email or SMS is the more preferred way to be notified.
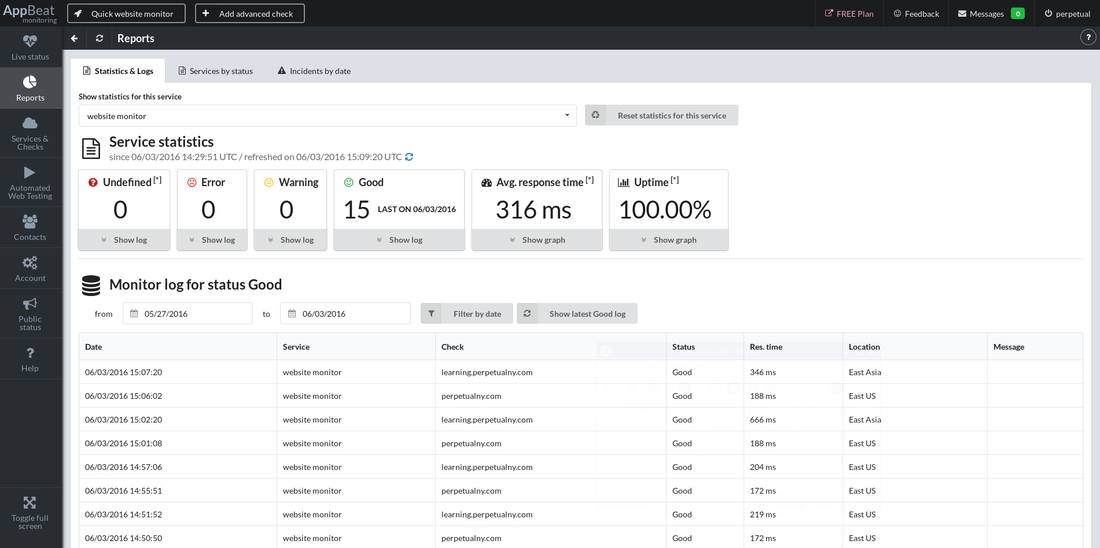
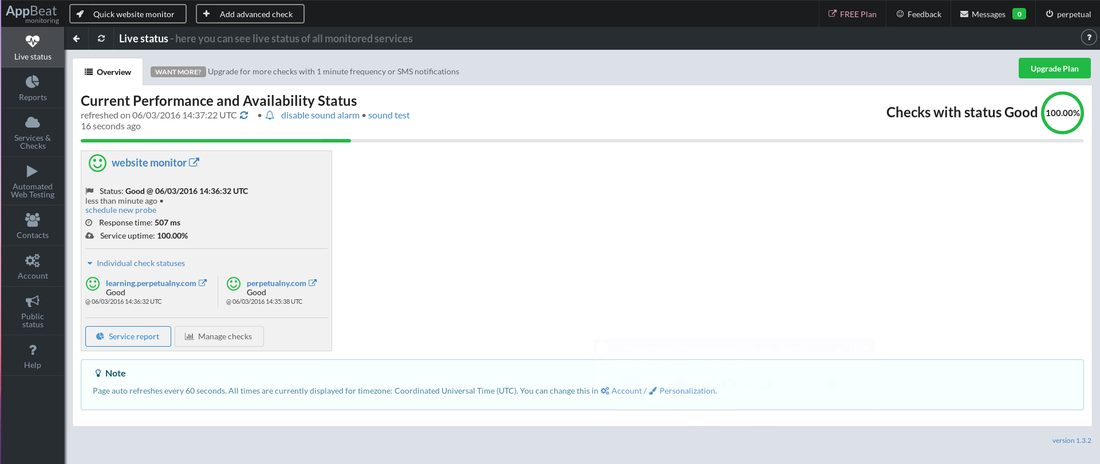
To see the monitor logs and service statistics, you can access this in the Reports section in the side panel.
- Click on “show log” on one of the categories i.e. error, undefined, warning, good to see the logs.