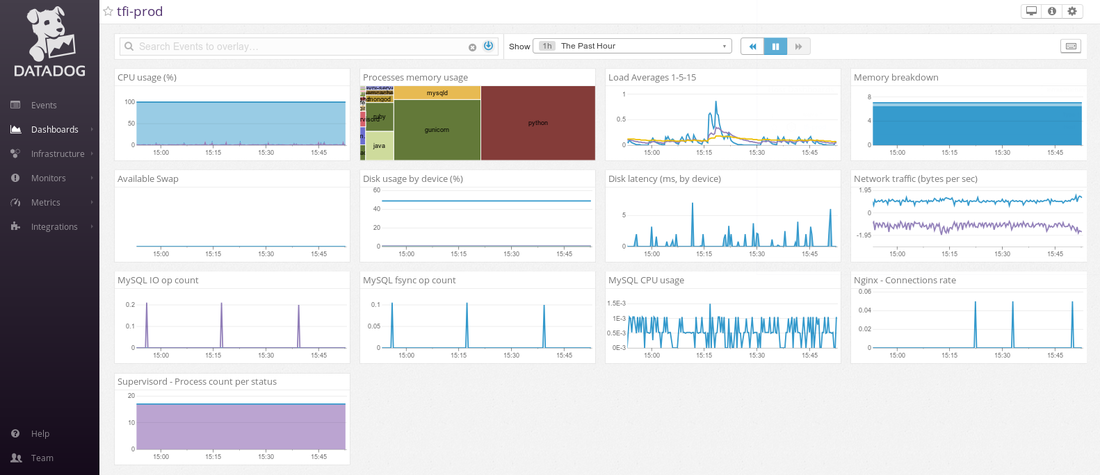
In the previous post we discussed the basics of port/latency monitoring using AppBeat. In this post we will discuss full stack server monitoring using a tool called Datadog.
Datadog is one of the leading appli
cation performance monitoring SaaS tools. We will cover how to setup a monitoring agent on your servers and configure Datadog to display metrics, trigger alerts, and even integrate with twilio to send SMS when there is a problem with the server.
Stack
The first thing to do is to sign up for the Datadog service here. Once completed, you can integrate your server into their dashboard by running the Datadog monitoring agent on your server as follows:
- Integrate Datadog into applications it supports; you can see if your software is supported by Datadog here
- You can install their agent directly into your machine as root.
- You can run their monitoring agent inside a docker container.
It’s a cross-platform monitoring agent that works on both Linux and Windows and integrates over 100 services. The full list is available here.
Installing the Datadog agent on the server
The installation procedure is pretty simple, once you login to your server:
- Go to Agents under the Integrations panel or go to this link:
- Elect your operating system and follow the instructions on the page to install datadog agent on your server.
E.g. on my ubuntu machine I had to run the following command:
DD_API_KEY=xxxxxxxxxxxxxxxxxxxxxxxxxxxxxxx bash -c “$(curl -L https://raw.githubusercontent.com/DataDog/dd-agent/master/packaging/datadog-agent/source/install_agent.sh)”
Once the agent is installed on your machine, go to the Datadog dashboard and see if any events appear on the event log.
You can find the default dashboard panel of your system at the bottom of the Dashboard List under the “Host Dashboards” section.
Integrating Twilio into Datadog
Twilio is an telecommunications SaaS platform where your can send SMS and make calls like as you would on a mobile phone.
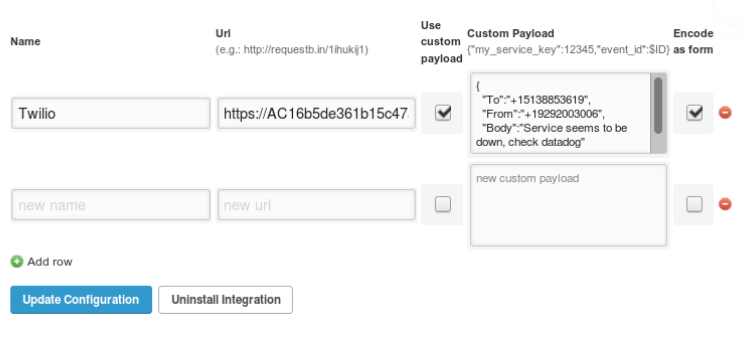
To integrate Twilio, follow this tab path to get to the configurations tab:
- Open Integrations under the Integrations panel on the side panel
- Select “Webhooks”
- Select the Configurations tab and scroll down to the bottom of the popup
To test if the Twilio integration is successful:
- Go to the Events page and input @webhook-twilio into the event box.
- Click post to trigger the webhook and if everything is configured correctly you should receive an SMS.1.
In order to proceed, you will need a Twilio Account SID and Auth Token which you can find under “Account Summary” on the Twilio Console.
- Copy both and replace them with ACCOUNT_SID and AUTH_TOKEN in the following URL:
- https://ACCOUNT_SID:AUTH_TOKEN@api.twilio.com/2010-04-01/Accounts/ACCOUNT_SID/Messages.json
2. Following, construct this message in twilio API format.
{
“To”:”+1XXXXXXXXXX”,
“From”:”+1YYYYYYYYYY”,
“Body”:”Service seems to be down, check datadog portal”
}
*(XXX) XXX-XXXX is your phone number and (YYY) YYY-YYYY is the twilio number.
3. Copy & paste the message in the content payload and check the “encode as form” box
4. Add the URL listed above into the URL field and “update the configuration”.
5. Create a new monitor and select the metrics you want to monitor and when it asks “What’s happening”, enter “@webhook-twilio” and save the monitor.
|
To test if the Twilio integration is successful, go to the Events page and input @webhook-twilio into the event box. Click post to trigger the webhook and if everything is configured correctly you should receive an SMS.
That covers how to monitor your app using Datadog and how to get notified. Note that the value you get out of Datadog is similar to what you would get by using a tool like New Relic which is a great tool, but comes with a premium price more suited for large corporations. For startups or others on a budget, Datadog could be your best friend. |


